News & information
Economics
The Bureau of Labor Statistics released its data on January 2018 employment on February 2. Nonfarm payroll employment increased by 200,000 and the unemployment rate held at 4.1 percent for the fourth consecutive month. The January results continue to point to a job market which has been improving over the last year, with the number of unemployed declining from 7.6 million in January 2017 to 6.7 million in January 2018, a decline of 12.5 percent. However, the number of unemployed increased by 1.6 percent from December to January.
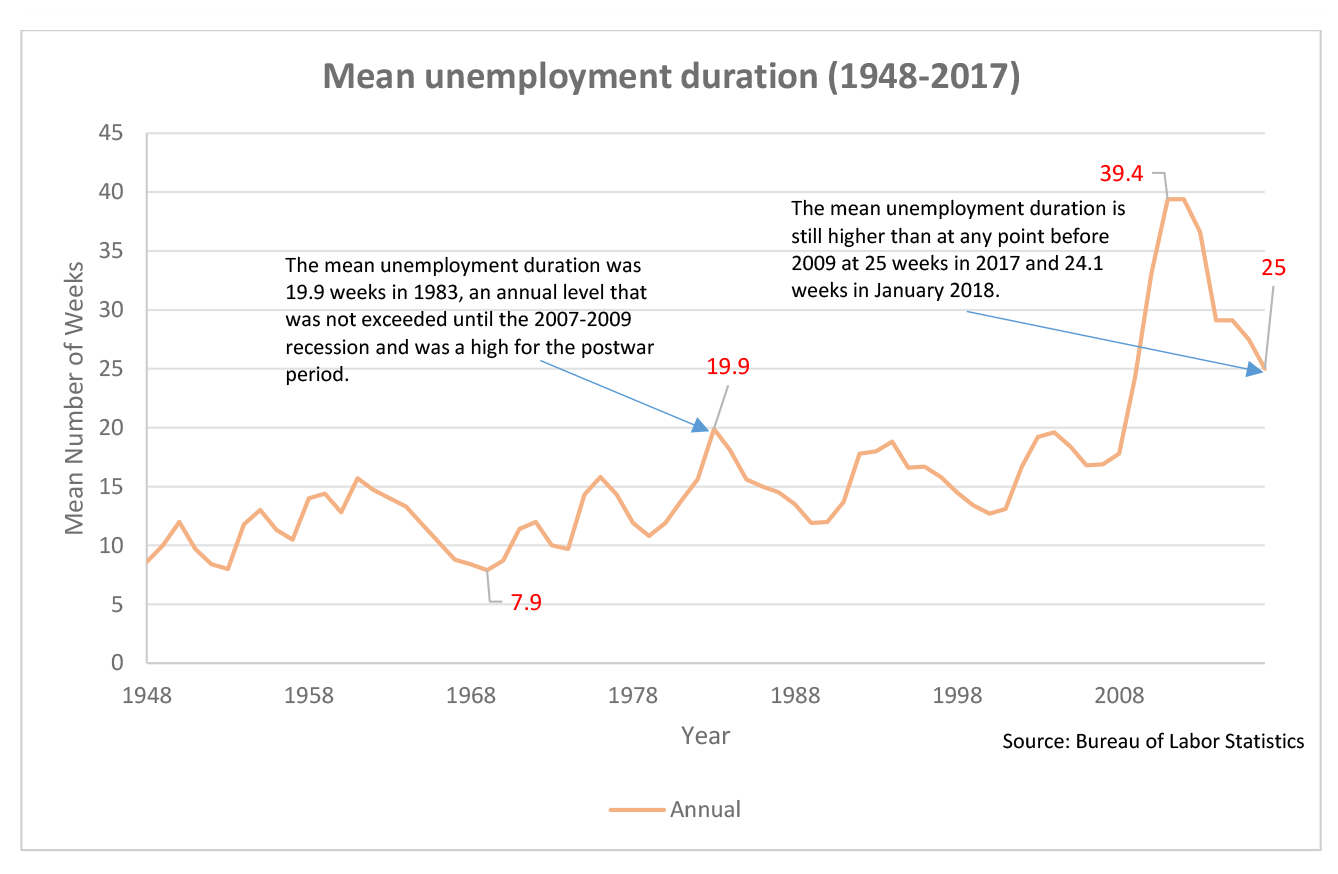
The data released on Friday points to continuing lags in the labor market and its implications for unemployed workers even in the so-called economic expansion. One interesting phenomena in the data is related to the average weeks a worker is counted as unemployed. A typical unemployed worker spent an average of 24.1 weeks (a little over six months) counted as unemployed in the official data. While this is a substantial improvement over the 40.7 weeks (a little over ten months) counted as unemployed in July 2011 it still takes longer to re-enter the labor market now than at any point from 1948 to 2009. The highest amount of time prior to the 2007-2009 recession was in July 1983 in the wake of the early 1980s recession (21.2 weeks). However, the number of weeks was only above 20 between March and October 1983 and then declined.
What is unique about the current labor market is that it seems that a new normal has been created in the aftermath of the recent recession, with workers staying unemployed for longer than in the past and for a sustained period of time (the average weeks unemployed has not fallen below 20 since January 2009. By contrast, in October 1969 the average number of weeks unemployed was 7.6 (less than two months) and the average for the period from 1966 to 1970 was 8.8 weeks, even as the unemployment rate hit a comparable level of 4.2 percent in February 1970. The below graph shows the mean unemployment duration from 1948 to 2017.
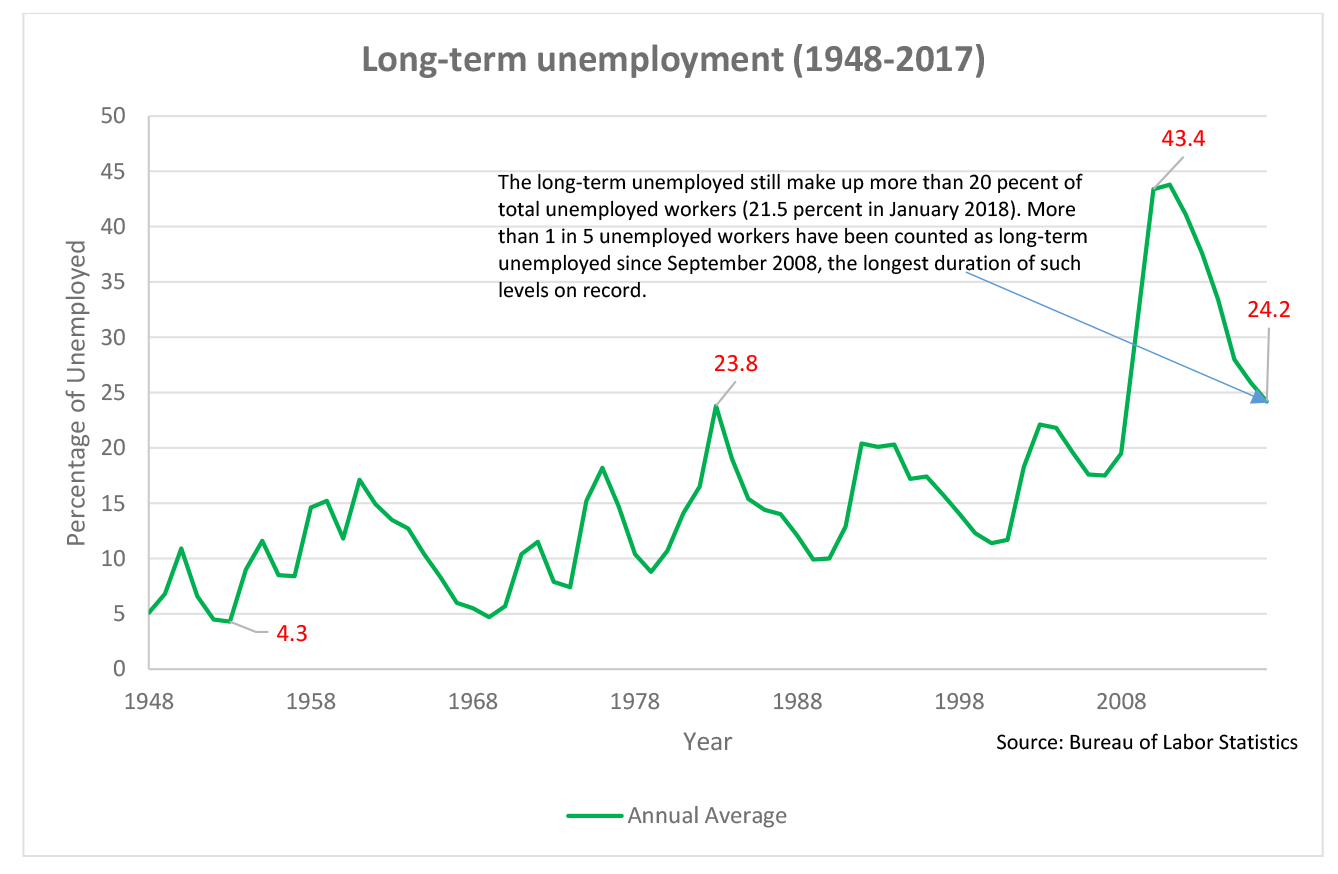
Unemployed workers today are also more likely to be long-term unemployed than in the past. A worker is counted as long-term unemployed if they are unemployed for 27 weeks or more (a little less than 6 months). In January 2018 these workers accounted for 21.5 percent of the total unemployed. Another way to look at this is that a worker who becomes unemployed has a >20 percent chance of being long-term unemployed and this has been true for almost a decade (September 2008), the longest duration of such levels on record. The below chart shows long-term unemployed as a percentage of total unemployment from 1948 to 2017.